Data Science 🔬📊🧠
Turn raw numbers into decisions that matter. Data science is the bridge between drowning in data and finding wisdom in it!
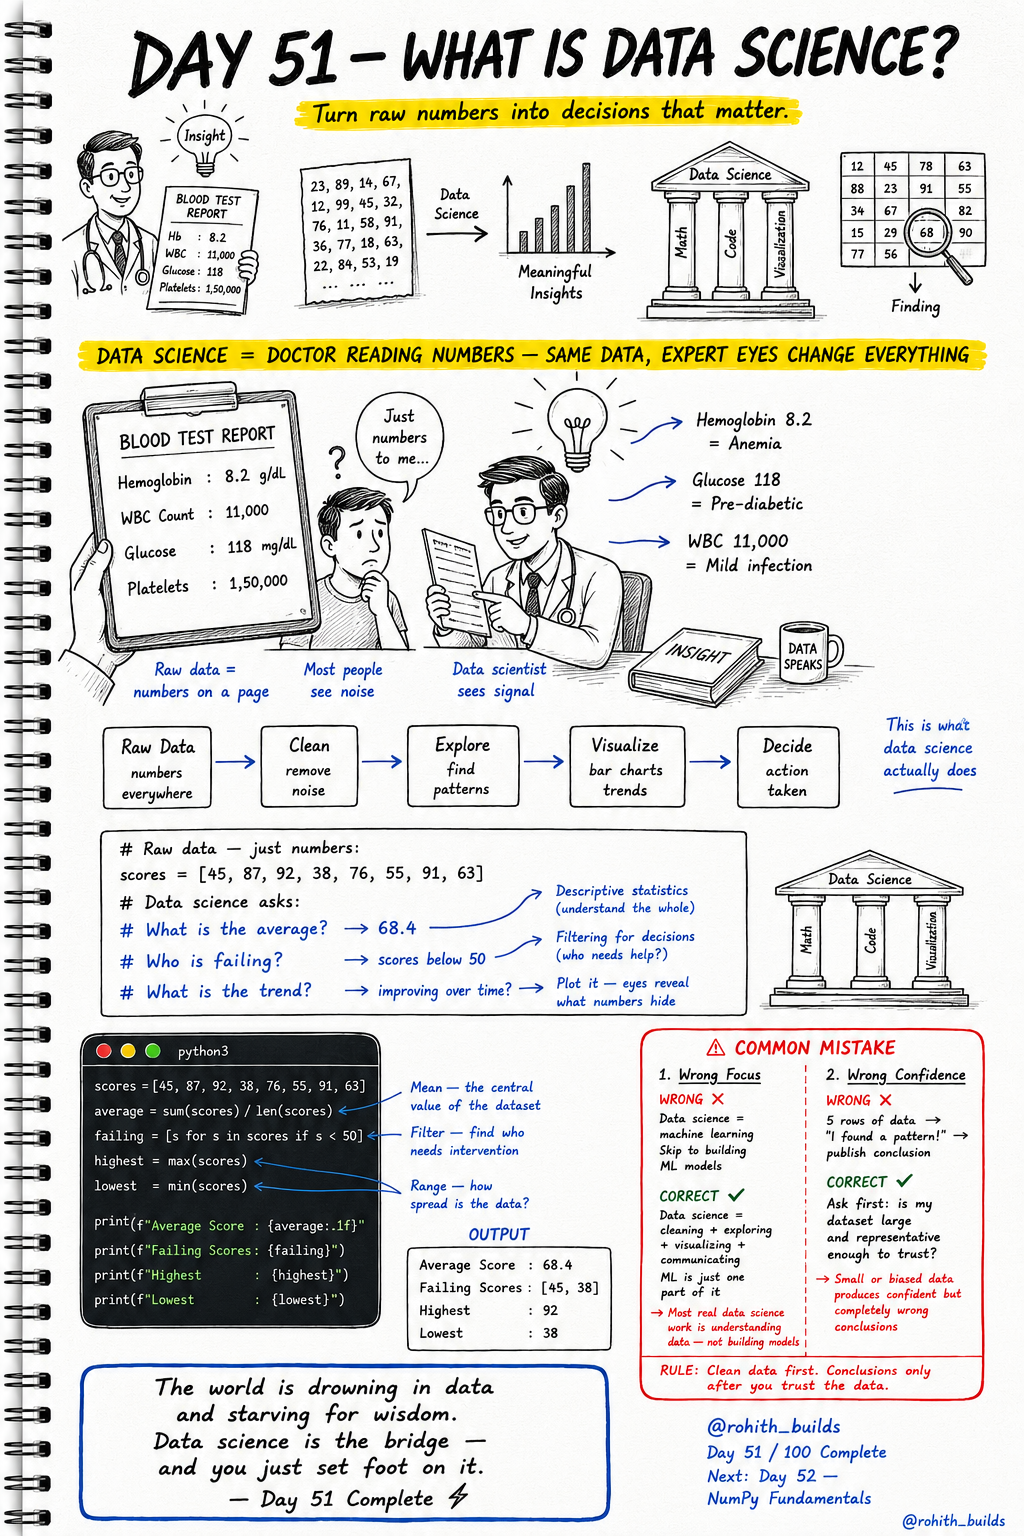
Day 51: What Is Data Science? — Turning Numbers Into Decisions!
What Is Data Science?
Imagine you get a blood test report. Hemoglobin 8.2, WBC 11000, Glucose 118, Platelets 150000. To most people — just numbers on a page. To a doctor — Hemoglobin 8.2 means anemia, Glucose 118 means pre-diabetic, WBC 11000 means mild infection. Same data. Expert eyes change everything. Data science is exactly that — turning raw numbers into decisions that actually matter!
What Data Science Actually Does
Step 1 — Raw Data: numbers everywhere, seemingly random. Step 2 — Clean: remove noise, fix errors, handle missing values. Step 3 — Explore: find patterns, ask questions, spot anomalies. Step 4 — Visualize: bar charts, trends, graphs that make patterns visible. Step 5 — Decide: take action based on what the data revealed. This is the real data science pipeline!
Data Science in Python
scores = [45, 87, 92, 38, 76, 55, 91, 63]

average = sum(scores) / len(scores)
failing = [s for s in scores if s < 50]
highest = max(scores)
lowest  = min(scores)

print(f"Average Score  : {average:.1f}")
print(f"Failing Scores : {failing}")
print(f"Highest        : {highest}")
print(f"Lowest         : {lowest}")
Output: Average Score 68.4, Failing Scores [45, 38], Highest 92, Lowest 38. Eight lines of Python turned raw numbers into insights — who needs help, what the class average is, who topped. That's data science at its simplest!
The Three Pillars of Data Science
Math — statistics, averages, distributions, probability. Understanding the numbers deeply. Code — Python, pandas, numpy. The tools that process millions of rows in seconds. Visualization — charts, graphs, plots. Because eyes reveal what numbers hide. Miss any one pillar and your data science is incomplete!
Real World Connection
When Hotstar decides which shows to recommend, data scientists analyze your watch history, find patterns, and build recommendations. When a hospital detects disease early, data scientists found patterns in thousands of blood tests. When IPL teams pick players, data scientists analyze thousands of matches to find the best combination. When Zomato predicts your delivery time, data science calculates patterns from millions of past orders. Data science is quietly running every intelligent decision around you!
Common Mistakes
Mistake 1 — Thinking data science means machine learning.
Data science is cleaning, exploring, visualizing and communicating data. Machine learning is just one part of it. Most real data science work is understanding data — not building ML models. Don't skip the fundamentals to rush to models!
Mistake 2 — Drawing conclusions from tiny datasets.
# WRONG — 5 rows is not enough to trust!
scores = [45, 87, 92, 38, 76]
print("I found a pattern!")   # dangerous conclusion!

# CORRECT — always ask: is my data large and representative?
# Small or biased data = confident but completely wrong conclusions!
Mini Challenge
Mini Challenge
Create a list of 10 student scores. Calculate the average, find all students above average, find all students below 50, and find the highest and lowest score. Print everything with clear labels. Then add one more question of your own — "how many students scored between 70 and 90?" You're now thinking like a data scientist!
Quick Quiz
Q: What are the five steps of the data science pipeline? A: Raw Data, Clean, Explore, Visualize, Decide — in that order!
Q: Is data science the same as machine learning? A: No! ML is just one part. Most data science is cleaning, exploring and communicating data!
Q: Why is visualizing data important? A: Because eyes reveal patterns that numbers alone hide — charts make insights obvious!
Key Takeaways
Key Takeaways
- Data science turns raw numbers into decisions — same data, expert eyes change everything.
- The pipeline is Raw Data, Clean, Explore, Visualize, Decide.
- Three pillars: Math (understand), Code (process), Visualization (communicate).
- Never draw conclusions from small or biased datasets — clean data first!
- The world is drowning in data and starving for wisdom — data science is the bridge!
Continue Learning with Rohi
You've used your 3 free Rohi questions. Create a free account to continue learning.